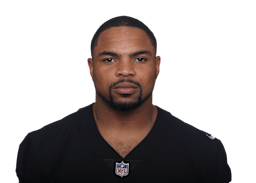
Doug Martin packed more value into his peak seasons than almost any running back in NFL history — a comet career that burned brightest when it mattered most. His KV-H peak of 79 is historically rare; while longevity was not his calling card, the impact of his best seasons is undeniable.
Career Value · VORP
113 career value over replacement — #973 all-time of 4,695. 16.1/season above a replacement-level RB.
Career Profile
Pick #31 (Rd 1) · TB · 2012 · +19.2 vs expected KV-H
Fan Rating
Rate Doug Martin — All-Time
Explore More
Similar Players
Season totals or exact team stints. Career totals count each season once.
| Season | Age | Team | G | GS | VAL | Rushing | Receiving | Snap Counts | Advanced Rushing (2018+) | ||||||||||||||||||||||||||
|---|---|---|---|---|---|---|---|---|---|---|---|---|---|---|---|---|---|---|---|---|---|---|---|---|---|---|---|---|---|---|---|---|---|---|---|
| Att | Yds | TD | Y/A | TD% | 1D | 1D% | Fmb | Tgt | Rec | Yds | TD | Ctch% | Y/R | Y/Tgt | AirYd/T | 1D | Off | Off% | Def | Def% | ST | ST% | YBC | YBC/Att | YAC | YAC/Att | BrkTkl | Att/Br | 1D | ||||||
| 2012 | 23–24 | TB | 16 | — | 7.4 | 319 | 1,454 | 11 | 4.6 | 3.4 | 58 | 18.2 | 1 | 70 | 49 | 472 | 1 | 70.0% | 9.6 | 6.7 | — | 18 | — | — | — | — | — | — | — | — | — | — | — | — | — |
| 2013 | 24–25 | TB | 6 | — | 0.0 | 127 | 456 | 1 | 3.6 | 0.8 | 16 | 12.6 | 0 | 24 | 12 | 66 | 0 | 50.0% | 5.5 | 2.8 | — | 1 | 304 | 74.0% | — | 0.0% | 1 | 0.5% | — | — | — | — | — | — | — |
| 2014 | 25–26 | TB | 11 | — | 0.0 | 134 | 494 | 2 | 3.7 | 1.5 | 23 | 17.2 | 0 | 20 | 13 | 64 | 0 | 65.0% | 4.9 | 3.2 | — | 3 | 345 | 49.8% | — | 0.0% | — | 0.0% | — | — | — | — | — | — | — |
| 2015 | 26–27 | TB | 16 | — | 3.8 | 288 | 1,402 | 6 | 4.9 | 2.1 | 61 | 21.2 | 4 | 44 | 33 | 271 | 1 | 75.0% | 8.2 | 6.2 | — | 10 | 622 | 56.6% | — | 0.0% | — | 0.0% | — | — | — | — | — | — | — |
| 2016 | 27–28 | TB | 8 | — | 0.0 | 144 | 421 | 3 | 2.9 | 2.1 | 23 | 16.0 | 1 | 16 | 14 | 134 | 0 | 87.5% | 9.6 | 8.4 | — | 4 | 321 | 58.9% | — | 0.0% | — | 0.0% | — | — | — | — | — | — | — |
| 2017 | 28–29 | TB | 11 | — | 0.0 | 138 | 406 | 3 | 2.9 | 2.2 | 21 | 15.2 | 1 | 18 | 9 | 84 | 0 | 50.0% | 9.3 | 4.7 | — | 6 | 287 | 38.0% | — | 0.0% | — | 0.0% | — | — | — | — | — | — | — |
| 2018 | 29–30 | OAK | 16 | — | 0.0 | 172 | 723 | 4 | 4.2 | 2.3 | 37 | 21.5 | 3 | 24 | 18 | 116 | 0 | 75.0% | 6.4 | 4.8 | — | 6 | 359 | 35.6% | — | 0.0% | 11 | 2.7% | 376 | 2.2 | 347 | 2.0 | 10 | 17.2 | 37 |
| Career | — | 84 | — | 11.2 | 1,322 | 5,356 | 30 | 4.1 | 2.3 | 239 | 18.1 | 10 | 216 | 148 | 1,207 | 2 | 68.5% | 8.2 | 5.6 | — | 48 | — | — | — | — | — | — | 376 | — | 347 | — | 10 | — | 37 | |
7 seasons · peak 7.4 in 2012
VAL (Value Above League) measures each NFL season against that season's league; the dashed line is zero — a season that added nothing above the league's fringe. ● peak · ○ league-best season.
0.9 career wins over 7 seasons · 1 win = 13.08 VAL
Best season · 2012 · +0.6 wins
0.6 of TB's 7 wins (8%)
| Season | Age | Team | G | GS | Att | Yds | TD | Y/A | TD% | 1D | 1D% | Fmb | VAL |
|---|---|---|---|---|---|---|---|---|---|---|---|---|---|
| 2012 | 23–24 | TB | 16 | — | 319 | 1,454 | 11 | 4.6 | 3.4 | 58 | 18.2 | 1 | 7.4 |
| 2013 | 24–25 | TB | 6 | 4* | 127 | 456 | 1 | 3.6 | 0.8 | 16 | 12.6 | 0 | 0 |
| 2014 | 25–26 | TB | 11 | 0* | 134 | 494 | 2 | 3.7 | 1.5 | 23 | 17.2 | 0 | 0 |
| 2015 | 26–27 | TB | 16 | 9* | 288 | 1,402 | 6 | 4.9 | 2.1 | 61 | 21.2 | 4 | 3.8 |
| 2016 | 27–28 | TB | 8 | 5* | 144 | 421 | 3 | 2.9 | 2.1 | 23 | 16.0 | 1 | 0 |
| 2017 | 28–29 | TB | 11 | 0* | 138 | 406 | 3 | 2.9 | 2.2 | 21 | 15.2 | 1 | 0 |
| 2018 | 29–30 | OAK | 16 | 0* | 172 | 723 | 4 | 4.2 | 2.3 | 37 | 21.5 | 3 | 0 |
| Career | 84 | 1,322 | 5,356 | 30 | 4.1 | 2.3 | 239 | 18.1 | 10 | 11.2 |
* GS not available from free sources — SG* estimated from snap share (nflverse 2012+)
| Season | Age | Team | G | GS | Tgt | Rec | Yds | TD | Ctch% | Y/R | Y/Tgt | AirYd/T | 1D |
|---|---|---|---|---|---|---|---|---|---|---|---|---|---|
| 2012 | 23–24 | TB | 16 | — | 70 | 49 | 472 | 1 | 70.0% | 9.6 | 6.7 | — | 18 |
| 2013 | 24–25 | TB | 6 | 4* | 24 | 12 | 66 | 0 | 50.0% | 5.5 | 2.8 | — | 1 |
| 2014 | 25–26 | TB | 11 | 0* | 20 | 13 | 64 | 0 | 65.0% | 4.9 | 3.2 | — | 3 |
| 2015 | 26–27 | TB | 16 | 9* | 44 | 33 | 271 | 1 | 75.0% | 8.2 | 6.2 | — | 10 |
| 2016 | 27–28 | TB | 8 | 5* | 16 | 14 | 134 | 0 | 87.5% | 9.6 | 8.4 | — | 4 |
| 2017 | 28–29 | TB | 11 | 0* | 18 | 9 | 84 | 0 | 50.0% | 9.3 | 4.7 | — | 6 |
| 2018 | 29–30 | OAK | 16 | 0* | 24 | 18 | 116 | 0 | 75.0% | 6.4 | 4.8 | — | 6 |
| Career | 84 | 216 | 148 | 1,207 | 2 | 68.5% | 8.2 | 5.6 | — | 48 |
* GS not available from free sources — SG* estimated from snap share (nflverse 2012+)
| Season | Age | Team | G | GS | Off | Off% | Def | Def% | ST | ST% |
|---|---|---|---|---|---|---|---|---|---|---|
| 2013 | 24–25 | TB | 6 | 4* | 304 | 74.0% | — | 0.0% | 1 | 0.5% |
| 2014 | 25–26 | TB | 11 | 0* | 345 | 49.8% | — | 0.0% | — | 0.0% |
| 2015 | 26–27 | TB | 16 | 9* | 622 | 56.6% | — | 0.0% | — | 0.0% |
| 2016 | 27–28 | TB | 8 | 5* | 321 | 58.9% | — | 0.0% | — | 0.0% |
| 2017 | 28–29 | TB | 11 | 0* | 287 | 38.0% | — | 0.0% | — | 0.0% |
| 2018 | 29–30 | OAK | 16 | 0* | 359 | 35.6% | — | 0.0% | 11 | 2.7% |
| Career | — | — | — | — | — | — | — |
Career games and per-game totals are unavailable because the season rows do not establish complete career coverage. Published career totals are preserved.
* GS not available from free sources — SG* estimated from snap share (nflverse 2012+)
| Season | Age | Team | G | GS | YBC | YBC/Att | YAC | YAC/Att | BrkTkl | Att/Br | 1D |
|---|---|---|---|---|---|---|---|---|---|---|---|
| 2018 | 29–30 | OAK | 16 | 0* | 376 | 2.2 | 347 | 2.0 | 10 | 17.2 | 37 |
| Career | 16 | 376 | — | 347 | — | 10 | — | 37 |
* GS not available from free sources — SG* estimated from snap share (nflverse 2012+)
| Season | Age | Team | G | GS | ADOT | YBC/R | YAC/R | BrkTkl | Drops | Drop% | 1D | TgtRate |
|---|---|---|---|---|---|---|---|---|---|---|---|---|
| 2018 | 29–30 | OAK | 16 | 0* | 0.9 | 1.2 | 5.2 | 1 | 2 | 0.1 | 6 | 84.7 |
| Career | 16 | — | — | — | 1 | 2 | — | 6 | — |
* GS not available from free sources — SG* estimated from snap share (nflverse 2012+)
A great career by KV-H: a peak-driven profile that scores 74 of 100, era-normalized against rush yds/g peers across 7 scored seasons.
Blend 73.6 × longevity 1 = KV-H 74· confidence 96%
Frank Gore
RB
89% match
2012 Draft ClassmatesFull class →
Latest season · 2018 · −0.3 wins
OAK's 4 wins · no wins above replacement this season
VAL 3.0 measures each part of a NFL player's game in his sport's own currency against what that season's fringe players produced, converted to team wins with rates fitted from every team-season in the encyclopedia. Team wins are the club's actual regular-season wins; a traded season, or one whose club record is missing, shows no share.
#81 of 1,228 all-time RBs by KV-H
Season-by-season quality (era-relative rush yds/g)