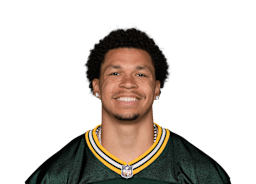
Mike Williams is a career quality starter — a receiver whose body of work places Williams in the top quarter of all players at the position historically. The Knox model values sustained contribution over flash, and Williams's career arc reflects exactly that kind of reliable professional-grade performance.
how this career measures against the all-time greats at the position
20
Depth
of 100
Reached 22% of the all-time Receiving Yards leader — a rotational/depth all-time profile at the position.
22% of the all-time Receiving Yards leader22
0 categories ≥25% of the all-time leader0
A 0–100 scale where 100 = matched the all-time leader at this position. Built only from visible encyclopedia data — career production vs. the all-time leader, plus efficiency (EPA) and comparable-player confidence — so it's a transparent context score, not a subjective rating. Tiers: Elite ≥ 85 · Strong ≥ 65 · Solid ≥ 45 · Depth < 45. Comparable-player confidence: 95%.
Encyclopedia Coverage7/8 data layers▼
StatVault aggregates multiple open-licensed and proprietary sources into a single profile. The depth indicator above shows which layers are available for this player.
Bio & DraftBirth date, height/weight, draft round/pick, college — sourced from nflverse players.csv (CC-BY 4.0). Covers all NFL eras.
Season Stats (1999–present)Week-by-week box scores aggregated to season totals: passing, rushing, receiving, defense. Source: nflverse player_stats. Counting stats are exact; rates are derived.
Advanced (EPA, 1999–present)Not available for this player
Snap Counts (2012–present)Offensive, defensive, and special-teams snap counts with team-share percentages. Essential for OL and situational players. Source: nflverse snap_counts.
Defensive StatsMaterial defensive production only: playmaking stats, 10+ tackles, or 50+ defensive snaps. Source: nflverse player_stats and snap_counts.
College StatsCollege attribution is present, but this profile artifact does not yet carry a parsed college stat table.
Modern-era stats (1999+) come from nflverse's open data releases. Pre-1999 seasons are backfilled additively from Wikipedia and NFL.com's own official season pages — never from rights-restricted sources.
Production per snap — the box score normalized by opportunity. SIS is z-scored within wide receivers, shrinkage-regularized so small samples don't spike, over the NFL snap-count era (2012+).
Career Aging Trajectory
vs. position group average · KV-H basis
Amber = this player (normalized to own peak). Indigo = average wide receivers aging curve. Group peak age: 25. Source: StatVault KV-H era (1999+).
Combine · 2017
Percentiles compare each raw measurement against position peers, the full combine pool, and the same draft class where enough samples exist.
College stats are not imported for this profile yet.
StatVault has the verified college attribution (Clemson), but no parsed college box-score table is present in this profile artifact. The section stays here so every profile has a consistent college-stats landing point without fabricating unavailable rows.
Reference Graph
Career teammates and draft class, derived from year-by-year rosters — every name is linked.
verified measurements and curated source-tagged facts
6'4" / 218 lb
Frame
32.5" vert / 121" broad
Explosion
15 reps
Bench power
Knox
StatVault's proprietary player intelligence, informed by full career data. How Knox works →
Historical Knox · KV-H
Era-normalized career quality — z-scored against 7-season peers. See all →
68
peak 74
Season Report Cards· KV-H era-normalized per season
D2017
B2018
B+2019
B2020
B+2021
B+2022
C2024
Availability
Career durability — games played vs. scheduled, across 8 seasons.
80%
Era Translator
Rec Yds translated to the 2026 NFL — each season's standing among its own-era peers, projected onto 2026's scoring environment. Modern-era (1999+) coverage.
Season
Actual Rec Yds
Rec Yds/G
→ 2026 Rec Yds
→ 2026 /G
2017
95
10.6
105+10
6.2
2018
664
41.5
650-14
38.3
2019
1,001
66.7
1,149+148
67.6
2020
756
54
898+142
52.8
2021
1,146
71.6
1,225+79
72.1
2022
895
68.8
1,176+281
69.2
2024
298
22.9
394+96
23.2
Data: nflverse:players, nflverse:player_stats, nflverse:player_stats_def, nflverse:snap_counts, nflverse:combine, nflverse:draft_picks · multi-source verified via the StatVault Oracle · updated 8/31/2026
Proprietary LayersKV-H (Knox Value-Historical) — era-normalized career rating 0–100 calibrated within position group (1999+ coverage). SIS (Snap Impact Score, 2012+) — per-snap production z-scored within position. VORP — value over replacement player. Durability IQ — games-played percentile adjusted for era.
Pre-1999 players have bio + draft data but counting stats are not available from any freely-licensed source. Players with ★ Career Only see verified career aggregates from nflverse draft_picks.
Above avg · 54th pct
Pos 54thAll 18thClass Pos 78thClass All 28th
TD — Receiving touchdowns.
Ctch% — Catch rate — receptions ÷ targets × 100. Measures how reliably a receiver turns opportunities into gains. 70%+ is elite.
Y/R — Yards per reception — receiving yards ÷ receptions. Measures big-play ability; 15+ is elite for WRs.
Y/Tgt — Yards per target — receiving yards ÷ targets. The single most complete receiving efficiency metric: accounts for both drops and incomplete targets. Elite receivers post 8+ yards per target.
AirYd/T — Air yards per target — average depth of route at time of target. High values indicate a deep threat role; low values indicate a slot/check-down role.
1D — First downs gained on receiving plays.
Defense
Tkl / Solo / Ast — Combined tackles (Solo + ½ Assist). Solo = unassisted. Ast = helped by a teammate.
TFL — Tackles for loss — stops made behind the line of scrimmage (run stuffs + QB contain).
QBHits — QB hits — any legal contact on the quarterback, including but beyond sacks (hurries that land).
Sk — Sacks — tackled the QB behind the line for a loss. Half-sacks shared between defenders.
Dis — Disruption plays = sacks + QB hits + TFL. The composite pass-rush / run-stop impact stat for one season. Elite pass rushers post 30+ disruption plays per season.
Sfty — Safeties — tackled the ball carrier in their own end zone.
Snap Counts (2012–present)
Off / Off% — Offensive snaps played and share of team total. The most reliable usage metric for skill positions and OL.
Def / Def% — Defensive snaps played and share of team total.
ST / ST% — Special-teams snaps played and share of team total.
Proprietary StatVault Metrics
KV-H (Knox Value-Historical) — Era-normalized career rating 0–100 within position group, calibrated so a 50 = average starter and 90+ = all-time great. Covers 1999–present. Built on a 5-year IQR/robust-std era window.
SIS (Snap Impact Score) — Per-snap production z-scored within position group and era (2012+). Measures how much a player produced per opportunity, not raw volume.
VORP (Value Over Replacement) — Sum of max(0, season KV-H − positional replacement level) across a career. Measures career value above the minimum-roster baseline at each position.
Durability IQ — 0–100 score reflecting how many games a player played relative to peers at the same position in the same era. Adjusts for injury-shortened seasons.
The room is reconstructed from arrival order among durable members (≥4 seasons with the club) at the player’s position group — a lineage by arrival, not a week-by-week depth chart. Distinct from the league-wide positional GOAT torch.